Nepal Earthquake, Apr 25 2015
From The Guardian
More than 1000 people have been killed after a major earthquake hit Nepal, toppling buildings in the capital, Kathmandu, and triggering avalanches in the Himalayas.
The death toll in the Himalayan kingdom has reached 1130 as of Sunday morning. Most of the fatalities are from the Kathmandu Valley, with at least 300 killed in the capital alone. Nepalese authorities earlier warned there were also likely to be significant casualties in the remote districts nearer the epicentre of the earthquake, 50 miles north-west of the capital.
Krishna Prasad Dhakal, deputy chief of mission at Nepal’s embassy in New Delhi, said: “Hundreds of people are feared dead and there are reports of widespread damage to property. The devastation is not confined to some areas of Nepal. Almost the entire country has been hit.”
Ram Narayan Pandey, of the Nepal Disaster Management Authority, said: “We are totally cut off from most parts of our country.”
Meanwhile, officials in India say that at least 20 people have been killed in the country, with dozens more injured. Reports also said that two people in Bangladesh have died in the earth quake, on top of more than 100 injuries.
The earthquake, which measured 7.9 on the Richter scale, sent tremors throughout much of south Asia at 11.41 Nepal local time on Saturday.
Specific Hypothesis and Results
The GCP event was set for 24 hours, as usual for large quakes with major destruction and loss of life. It begins at 11:00 local time, 41 minutes before the main temblor (05:15 UTC). The result is 86662.736 on 86400 df, for p = 0.263 and Z = 0.633.
Interpretation
The following graph is a visual display of the statistical result. It shows the second-by-second accumulation of small deviations of the data from what’s expected. Our prediction is that deviations will tend to be positive, and if this is so, the jagged line will tend to go upward. If the endpoint is positive, this is evidence for the general hypothesis and adds to the bottome line. If the endpoint is outside the smooth curve showing 0.05 probability, the deviation is nominally significant. If the trend of the cumulative deviation is downward, this is evidence against the hypothesis, and is subtracted from the bottom line. For more detail on how to interpret the results, see The Science and related pages, as well as the standard caveat below.

Standard caveat
It is important to keep in mind that we have only a tiny statistical effect, so that it is always hard to distinguish signal from noise. This means that every success
might be largely driven by chance, and every null
might include a real signal overwhelmed by noise. In the long run, a real effect can be identified only by patiently accumulating replications of similar analyses.
In some previous earthquake analyses, we have found it instructive to explore other measures of data deviations around the time of the main temblor. First we look at the variance of the data. This is a post hoc analysis, so we cannot draw statistically based conclusions. A picture of the extreme variance deviations during the 9/11 event is included for comparison.

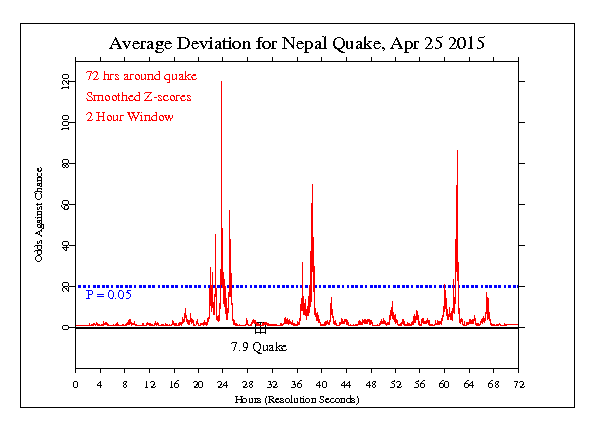
Next we look at the raw data, smoothed to reduce the high frequency noise. Here we look at a 72 hour period surrounding the main 7.9 temblor. The graph shows the odds against chance for deviations that show as spikes against the null background. An hour-long disturbance appears to begin about 2 hours before the quake, and two more large spikes appear afterwards.

