Terrorist Disaster, September 11 2001


Note added in 2009: This page reports various exploratory analyses of the 9/11 data. Most were contributed in the months following the Sept. 11 attacks. In the ensuing years, we have developed a more sophisticated understanding of the GCP data, and the analyses below do not reflect all that we have learned. One important understanding is that the average effect size across all events is half a standard deviation or less. Thus, the experimental effect is in general too weak for reliable interpretation of individual events. From careful re-analysis we know that even in a strong case such as 9/11 the data are only marginally significant. It was a powerful event and the graphical displays in these pages seem impressive, but even so, the 9/11 results alone should not be taken as proof of a global consciousness effect -- that requires the patient accumulation of replications.

On September 11, 2001, beginning at about 8:45 in the morning, a series of terrorist attacks destroyed the twin towers of the World Trade Center and severely damaged the Pentagon. The disaster is so great that in New York we have as yet, two days later, only guesses about how many thousands of people perished when the WTC towers collapsed. Commercial airliners were hijacked and flown directly into the three buildings. The first crashed into the North tower at 8:45, and about 18 minutes later the second airliner hit the South tower. At about 9:40, a third airliner crashed into the Pentagon. At about 9:58, the South tower collapsed, followed by the North tower at 10:28.

The following material shows the behavior of the Global Consciousness Project's network of 38 REG devices called "eggs" placed around the world as they responded during various periods of time surrounding September 11. These eggs generate random data continuously and send it for archiving and analysis to a dedicated server in Princeton, New Jersey, USA. We analyse the data to determine whether the normally random array of values shows structure correlated with global events. The underlying motivation for this work is to discover whether there is evidence for an anomalous interaction driving the eggs to non-random behavior. In a metaphoric sense, we are looking for evidence of a developing global consciousness that might perceive and react to events with deep meaning.

The whole world reeled in disbelief and horror as the news of the terrorist attack and the unspeakable tragedy unfolded. The EGG network registered an unmistakable and profound response.

Introduction

I want to acknowledge that I like the idea of Global Consciousness, but that this idea is really an aesthetic speculation. I don't think we have real grounds to claim that the statistics and graphs representing the data prove the existence of a global consciousness. On the other hand, we do have strong evidence of anomalous structure in what should be random data, and clear correlations of these unexplained departures from expectation with well-defined events that are of special importance to people. The events share a common feature, namely, that they engage our attention, and draw us in large numbers into a common focus.

This is a report of what we see in the data recorded on September 11, 2001 and the surrounding period. It is the best description we can give of measurements and effects that are essentially mysterious. We do not know how the correlations that arise between electronic random event generators and human concerns come to be, and yet, the results of our analyses are unequivocal. We cannot explain the presence of stark patterns in data that should be random, nor do we have any way of divining their ultimate meaning, yet there is an important and uniquely powerful message here. When we ask why the disaster in New York and Washington and Pennsylvania should appear to be responsible for a strong signal in our world-wide network of instruments designed to generate random noise, there is no obvious answer. When we look carefully and discover that the eggs might reflect our shock and dismay even before our minds and hearts express it, we confront a still deeper mystery. This network, which we designed as a metaphoric EEG for the planet, responded as if it were measuring brain waves on a planetary scale. We do not know if there is such a thing as a global consciousness, but if there is, it was moved by the events of September 11, 2001. We do not know how, but it appears that the coherence and intensity of our common reaction created a sustained pulse of order in the random flow of numbers from our instruments. These patterns where there should be none look like reflections of our concentrated focus, as the riveting events drew us from our individual concerns and melded us into an extraordinary coherence. Maybe we became, briefly, a global consciousness.

These are pictures drawn from the data, with brief descriptions of the exact procedures for those who want to know the details. We use statistical and mathematical tools to visualize the structures that appear, and graphs to display them. But these are transparent images, pictures worth a thousand words.

Deviations from Chance Expectation

First, we show the results of our standard analysis, plotting the departures of the data from its expected behavior, which is a random walk centered on a horizontal path. The data from all the eggs are combined (as a Stouffer Z) in a single score for each second, these Z-scores are squared, and the cumulative deviation from chance expectation of the resulting sequence is plotted. More information about the methods of analysis is given in the Statistics Notes below. Many of the following graphs do not represent formal tests of a pre-specified hypothesis; the formal tests are identified.

The first figure shows the period from September 7th to 13th, and the attack is marked with a black rectangle. You can see that shortly before the terrorist attack, the wandering line takes on a clear trend representing a persistent departure from what is expected of random data. A small probability envelope inserted at that point provides a scale to indicate the extraordinary increase in non-random deviation. The slope of the graph beginning just before the the first WTC tower was hit and continuing for nearly three days, to the end of the 13th, is extreme. An informal estimate for the probability can be made, and lies between 0.003 and 0.0003 (an odds ratio on the order of 1 in 1000). If we extrapolate the anomalous trend, it begins at about 04:00 (08:00 GMT), several hours before the first World Trade Center tower was hit.

Context graph:
Terrorist Attacks, September 11 2001

Odds Against Chance

The next figure shows the raw odds against chance for the squared Stouffer Z-scores (Chisquares) for September 11. The maximum odds ratio is equivalent to a Z-score of 4.81, and occurs at 10:12:47, EDT. A Z-score this large would appear by chance only once in about a million seconds (roughly two weeks).

One Hour
smoothing of odds: Terrorist Attacks, September 11 2001

The data are treated in a different way by Dean Radin in a series of explorations seeking more insight. A sampling of these analyses is shown in the following figures. The treatment of the low-level data is different from the GCP's standard approach. Instead of a composite (Stouffer) Z across eggs, Dean first calculated the Z-score per egg and summed the squared Z-scores and degrees of freedom across eggs. He then compressed the per-second data for all eggs into per-minute data for all eggs for the period from September 3 - 13. The probabilities associated with the sums of Z-squares were then calculated, and converted to the Z-score equivalent. Finally, the odds against chance for the cumulative Z-square was plotted to produce this graph.

Dean says, "These effects are the most strikingly persuasive evidence I've seen so far that mass-mind attention/intention affects the physical world, perhaps because this event has also been the most horrific."

Terrorist Attacks, Dean Radin 1

Here is a more detailed view of data from September 11th alone. The original Z-square data show a big rise beginning at about 05:00, and then an extraordinary drop of 6.5 standard deviations in a period of 8 hours or less beginning at about 11:00, New York time. The probability of such a large change, determined by randomized permutation analysis applied to data from June 15 to Sept 18, is p = 0.002. Here is what those data look like plotted as the two-tailed odds against chance for the Z-scores.

Terrorist Attacks, Dean Radin 11th, odds detail

Using exploratory methods to visualize the structure, it appears from several perspectives that there is a concentration of strong deviations around the major events of September 11. An important question, both theoretically and practically, that quickly comes to mind is whether distance makes a difference. Dean has done a careful analysis of results by location that is detailed in the context of validity checks on the procedures, and studies of the timing of the egg network response.


More Odds against Chance

Dean explored several views of the same data using variations of the basic calculations and smoothing or moving average techniques, as shown in the next figures, which use empirical instead of theoretical variance for the Z-score calculations. His description:

This graph shows results for a 6-hour sliding window, in terms of z scores, from Sept 6 - 13. In this graph, positive z's mean the RNGs became "more ordered" than expected by chance. Negative z's mean the RNGs became "more random" than expected by chance. The peak value in this graph is 9:10 AM, Sept 11. Between the beginning of the tragedy and 7 hours later this data shows a drop of 6.5 sigma (odds against chance of 29 billion to 1). Such large changes will eventually occur by chance, of course, but this particular change happened during an unprecedented event, suggesting that this "spike" and "rebound" were not coincidental.

Indeed a permutation analysis shows that the likelihood of getting a 6.5 sigma drop in Z-scores (based on a 6-hour sliding window) in one day, and within 8 hours of less (as observed) is p = 0.002.

Radin window_z.emp.jpg

For the next figure, 2-tailed probabilities were calculated (to register extreme decreases as well as increases in the deviations), and a larger smoothing window of six hours instead of three hours was used. In this case the odds against chance for the Chi-square was plotted. Again, there is an extraordinary spike at the time of the attacks. Though the display is very different, there is no ambiguity about the timing or the magnitude of the major spike.

Terrorist Attacks, Dean Radin 2

To help assure that there was no mistake in the processing, this same figure was recreated using algorithmically generated pseudo-random data instead of the real data generated by the truly random eggs located in countries all around the world. This figure speaks for itself.

Terrorist Attacks, Dean Radin 3

Many other examples from the exploratory work are available in the extended analysis page, and links found there.

Formal Predictions

The Global Consciousness Project has a standard protocol for testing the hypothesis that great events in the world may affect the eggs in a way that can be detected by statistical analysis. The formal prediction for this event is essentially the same as that made for the terrorist bombing in Africa in August 1998. That specified a period beginning a few minutes before the bombing, and including an aftermath of "a few hours." The actual time was from 10 minutes before the bombing to three hours after. We use in this case 10 minutes before the first crash to four hours after, which makes the aftermath period roughly the same following the last of the major cataclysmic events. The measure we use is the Chi-square representing the magnitude of the departure of the eggs' data from theoretical expectation, which is accumulated over the time defined for the analysis. See the Statistics Notes below below for more detail.

The resulting graph of data from the formal prediction shows a fluctuating deviation during the moments of the five major events, as ever-increasing numbers of people around the world are watching and hearing the news in stunned disbelief. Times of the major events are marked by boxes on the line of zero deviation. The uncertain fluctuation of the EGG data continues for almost half an hour after the fall of the second WTC tower. Then, at about 11:00, the cumulative deviation takes on a strong trend that continues through the aftermath period and ultimately exceeds the significance criterion, with a final probability of 0.035 (Chi-square is 15314 on 15000 degrees of freedom. The number of eggs at the time of this analysis was 36; one more egg reported later and including it reduces the probability to 0.028.) As we have seen, this significant departure from expectation continues over many more hours, actually at least two full days. Our formal prediction of an aftermath of a few hours was obviously far too conservative.

Formal graph: 
Terrorist Attacks, September 11 2001

Formal: Variance of the Egg data

The next figure shows the cumulative deviation of a measure of the variability of scores (variance) among the 37 eggs over the course of the day of September 11. It was generated as a test of Dean Radin's prediction that the variance would show strong fluctuations: "I'd predict something like ripples of high and low variance, as the emotional shocks continue to reverberate for days and weeks." Although this was only a partial specification it is effectively a prediction that the variance around the time of the disaster should deviate from expectation. I added the necessary specifications for a formal prediction.

The variance measure shows a normal fluctuation around the horizontal line of expectation until about three or four hours before the attack, and then a steep and persistent rise indicating a great excess of variance, continuing until about 11:00. Shortly thereafter, a long period begins during which the data show an equally precipitous decrease of variance. It is difficult to make a direct calculation of probability for this figure, but the extreme excursion in Dean Radin's similar analysis reaches a level of more than three sigma, which corresponds to odds of less than 1 in 1000.

A more conservative estimate is included in the formal database. It is based on assessing the fast rise and the fast fall of the variance measure surrounding the period of the attacks. The probability for each was calculated by extrapolation of the probability envelope as far (as many seconds) as would be needed to achieve the extreme rise or fall by chance, compared to the much shorter envelope that covers the time of the actual rise or fall. The ratios of these times were divided by the square root of 2 to compensate for the fact that a penetration of the envelope by a cumulative deviation trace sometime during the cumulation is twice as likely as the terminal probability. The resulting estimate is p = 0.096.

For a visual indication of the likelihood that this is merely a random fluctuation, a comparison can be made with pseudo-data generated for September 11, 2001, and plotted in the same format. In contrast to the real data, there are no long-sustained periods of strong deviation in the algorithmically generated data. Given the context of the surrounding days and the comparison with the pseudo-data, this figure shows that the variance measure is highly unusual around the time of the attacks.

In this figure, the times on the X-axis are Eastern Daylight Time, allowing a direct assessment of the timing of the strong deviations. The distinctive shape of the graph is suggestive of a classic "head and shoulders" graph seen in stock market analysis. As in the first figure showing the cumulative deviation of the Chisquare, there is an indication that the effects registered for this horrendous event might have begun several hours prior to the first attack. Again, the pseudo data are used for a direct comparison.

Terrorist Attacks,
September
11 2001

More on this topic, in the context of exploratory analyses, can be found on the extended analysis page.

Formal: Silent Prayer

Since the horrible event, innumerable calls for prayer have been made. On the 14th of September there was a special emphasis on such collective spiritual moments, including major organized periods of silence in Europe and America. Doug Mast made a specific formal prediction for a deviation of the Chisquare "over the time periods 1000 to 1003 GMT, corresponding to a European organized mourning (http://www.cnn.com/2001/WORLD/europe/09/14/europe.mourning/) and the time period 1200 to 1203 EDT (1600 to 1603 GMT) corresponding to the beginning of the Washington service and many organized mourning events in the Eastern US." Here is the resulting graph.

Doug Mast Pred: 
Silent Prayer, September 14 2001

The result is very compelling, I think, although it does not confirm the formal prediction. Instead, the trend shows a marginally significant decrease in the deviations of the egg data. The Chisquare is 150.68 on 180 degrees of freedom, with probability 0.9455. The trend is steadily opposite to the usual (and specified) direction, but I think it somehow looks right -- symbolic of the moment's contrast to the preceding days.

Although there was no formal prediction made for a reaction of the EGG network to the event, we do not want to forget the heroic sacrifice that brought down the fourth hijacked plane. Exploratory analyses of the time prior to the crash itself suggest a poignant correlation ­ an extraordinary rise in the cumulative deviation followed by a precipitous fall.

Interpretation

To begin, I want to acknowledge that the very best we can do is to report the data honestly and completely, because we do not have a theoretical understanding of the sort that must underlie robust interpretations. Of course we try hard to understand, and we are asked to explain the results. It is important to identify the answers we give as speculative and provisional, but having said that, I would like to describe a speculation that appeals especially to my aesthetic self, to my right brain. You can find more general discussion of alternatives and cautions elsewhere on the website.

One way to think of these startling correlations is to accept the possibility that the instruments have captured the reaction of a global consciousness beginning to form. The network was built to do just that: to see whether we could gather evidence of a communal, shared mind in which we are participants even if we don't know it.

Groups of people, including the group that is the whole world, have a place in consciousness space, and under special circumstances they ­ or we ­ become a new presence. Based on evidence that both individuals and groups manifest something we can tentatively call a consciousness field, we hypothesized that there could be a global consciousness capable of the same thing. Pursuing the speculation, it would seem that the new, integrated mind is just beginning to be active, paying attention only to events that inspire strong coherence of attention and feeling. Perhaps the best image is an infant slowly developing awareness, but already capable of strong emotions in response to the comfort of cuddling or to the discomfort of pain.

The hypothesis we set out to test is that the REG devices we use may respond to the concerted effect of large numbers of people turning their attention in one direction, becoming absorbed in the same focus. The terrible events of September 11 were a powerful magnet for our shared attention, and more than any event in the recent memory of the world they evoked the extraordinary emotions of horror and fear and comiseration and dismay.

The EGG network reacted in a powerful and evocative way. While there certainly are sensible alternative explanations, this is not a mistake or a misreading. It can be interpreted as a clear, if indirect, confirmation of the hypothesis that the eggs' behavior is affected by global events and our reactions to them. More important than any scientific question, however, is the question of meaning. What shall we learn, and what should we do in the face of compelling evidence that there may be such a thing as global consciousness? In fact this is not a new question. The results from this scientific study are an apparent manifestation of the ancient idea that we are all interconnected, and that what we think and feel has effects on others, everywhere in the world. The implication of the GCP/EGG data reflecting our shock and dismay is in some sense quite obvious. It says that even insensate electronic random generators can see the effects of hatred born of pain and despair. It means that the earth cannot support us in comfort as things now are. It urges a new understanding that we must learn to accept each other and help and support each other, everywhere in the world, if we are to live in peace on this beautiful earth.

Statistics Notes

What is the procedure used to create the Chisquare and Variance graphs, and how should they be interpretated?

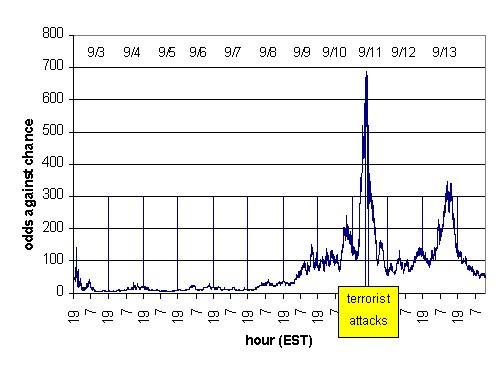
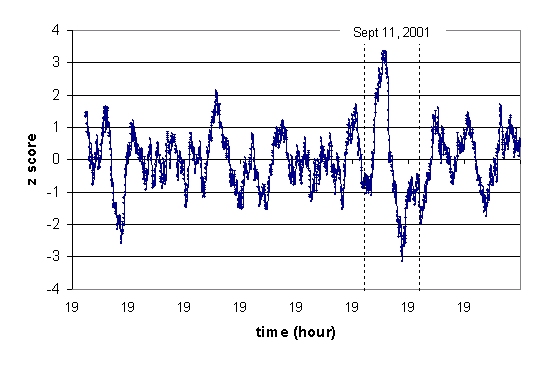
The Chisquare figures show the cumulative deviation of the second-by-second local deviations from expectation, compounded across the N eggs (N=36 to 38 at this time). That is, for each second, the Z's for all the N eggs are added and normalized by sqrt(N), then the resulting Z is squared to yield a Chisquare with 1 df, and finally the Chisquares-1 (Chisq=1 is the expectation) are cumulatively summed, to represent the departure from expectation. More details are available in exact descriptions of the GCP methods and procedures and in the extended analysis page.

The Variance figures show something similar, but instead of the compounded Z across eggs, the variance (squared standard deviation) is computed across the N eggs for each second. The sequence of Variance-50 (Var=50 is the expectation) is then cumulatively summed as before.

The Chisquare figure displays extreme departures, in either direction, of the trial scores of the egg from what is expected by chance. The Variance figure displays the degree of variability among the trial scores for the eggs. Chisquare addresses movement of the central value of the distribution, Variance represents changes in the range or width of the distribution.

What is the difference in the the analyses by Roger Nelson and Dean Radin?

The most important difference is in the treatment of the data at the finest scale. Neither way is superior, but there is a difference in what is expected or hypothesized about the behavior of the eggs in the presence of a possible influence. The two perspectives are complementary, and though they are not fully independent, using both contributes to our confidence that the apparent effects are not accidents or mistakes.

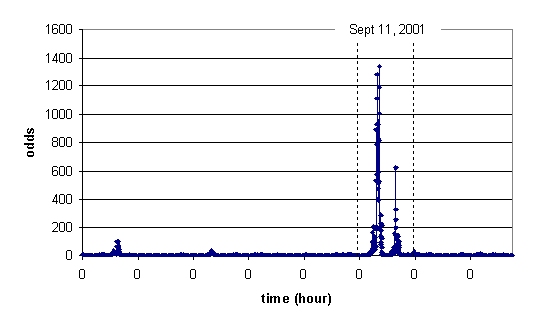
For each second, Roger calculates what is called a Stouffer Z across the eggs as described above. This means that in order to produce a large deviation, the eggs have to have a positive correlation ­ to be doing the same thing. This composite Z is squared, so it does not matter whether the average value is shifted to the high or low direction, but there must be some excess deviation and there must be a tendency toward inter-egg consistency in the direction of deviation. The result is a single squared Z-score, which is Chi-square distributed, for each second.

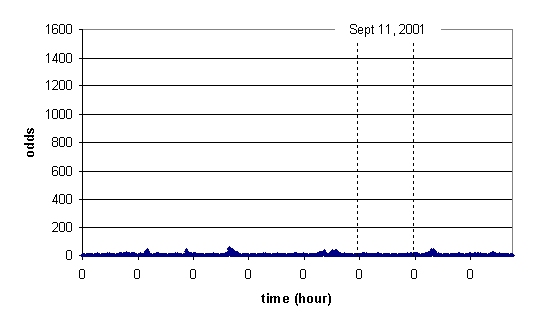
Dean calculates a Z-score for each egg separately, and squares these individual Z-scores. He then sums the squared Z's across the eggs, producing a a single Chi-square for each second. In this case, the eggs are not expected to show a positive correlation, and a high score requires only that there is a tendency for excess deviation in either direction; no inter-egg consistency in the direction of deviation is predicted. Again, the result is a single squared Z-score, which is Chi-square distributed, for each second.

Dean's method of summing Z² is closely related to Roger's variance analysis.

More

Many other analyses and graphs have been generated, and some show certain details and perspectives that may interest you. The extended analysis page has most of the figures shown here, but in the context of the developing analysis program over the first few days following the tragedy. A question of particular interest is whether distance makes a difference. Dean Radin separated the results by location of the eggs in a careful analysis. Peter Bancel has been looking at the interegg correlations and has provided a draft report. There is also an Interpretations page in the works, and one that simply presents the flood of messages from people all over the world who are involved in the GCP/EGG project. For more details about the project itself, you can go to the GCP home page where you will find links to all aspects.


GCP Home